I can see sound. I can look at a speaker array and see the waves coming out of it as clear as the ripples on a pond. I can look at the walls of a room or concert hall and see the reflections.
I am not unique. Anyone can see sound. All you need is an understanding of phase response and how changing phase response over frequency affects the sonic quality of a single speaker, the interaction of multiple speakers and the interaction of the speakers in the room.
The majority of concert system engineers have never seen a phase vs. frequency response of their system. The low cost of dual-channel FFT analysis systems has made this information much more accessible than even just five years ago, but, still, very few know what to do with the results of this information when they get it. And yet not one of us would say it doesn’t matter.
The purpose of this two-part series is to present phase in a practical context for system engineers who are anxious to apply the information to improve their decisions regarding speaker selection and alignment. In Part 1, we will explore three principal avenues:
- How to read a phase response graph.
- How the phase response relates to the sound quality of a single speaker.
- The relationship between phase and polarity.
Part 2 will explore how phase delay can be used to optimize crossovers, maximize array performance and steer subwoofers.
PHASE OVER FREQUENCY
First, let’s define phase in a way that makes sense to those of us who don’t wear lab coats nor have letters trailing after our names. What we want is a way to visualize phase so that we can relate it to distance. If two speakers are a foot apart, how much phase shift will occur? Will they add or subtract? What will be the effect on the frequency response of reflections from a wall? These are the kinds of questions we can answer if we have a practical grasp of phase.
In order to become conversant about phase, the first step is to realize that relative phase is a circular function and cycles through the same start point like the hands of a clock — 360° of phase equals one full rotation or cycle. Because phase describes the relative time difference between two signals, it can be expressed in degrees or radians, which measure the completed portion of a circular period or wavelength. For example, 90° of phase delay is a quarter of a period (wavelength) at any frequency. The amount of time delay it takes to move apart 90°, however, is frequency-dependent. Thus, a given time delay will produce different amounts of phase shift at different frequencies.
Acoustic propagation delay is directly related to distance, varying slightly over temperature. In air, 1.0 ms of delay corresponds approximately to 1.1 feet of distance traveled by the sound wave. So, if we know the propagation distance, then we know the time delay. If we know the frequency, then we know the period (1/F) and the wavelength. (It helps if you can always think of frequency, period and wavelength together. Don’t just think of 100 Hz. Think of 100 Hz, 10 ms, 11 feet.) Once you visualize distance in wavelengths, then you can see how speakers will interact with each other and a room. They will add or subtract depending on the difference in number of wavelengths between the speakers or reflections at a given position. This will be explained later.
Phase delay is the time difference expressed in periods (wavelengths). The practical implications of this are huge.
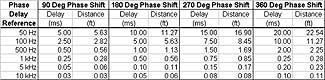
Example: One ms of delay = 1.1 feet of travel = 11° of phase delay (1/32 wavelength) at 31 Hz. One ms of delay = 1.1 feet of travel = 360° of phase delay (1 wavelength) at 1 kHz. One ms of delay = 1.1 feet of travel = 5,760° of phase delay (16 wavelengths) at 16 kHz. (See Phase Delay Reference table below.)
Now think of all the time you have spent pushing subwoofers a few inches to get them all in a nice line. Aesthetics are important, but don’t pretend that 2° of phase shift is going to be worth the backstrain. On the other hand, those same two inches will cause almost 1,000° of phase shift at 16 kHz — it really counts up there.
CALCULATING PHASE DELAY
Let’s start with the phase delay formula:
This formula can be used to calculate phase delay at a particular frequency or range of frequencies. Let’s do a single frequency first. For 180° of phase shift at 500 Hz, we get 1 ms as shown below:
Now let’s apply this knowledge to a phase response display, as shown on a modern, complex audio analyzer. These analyzers compute the phase response by comparing the measured signal to a reference signal, which yields a relative phase over frequency response. (The term “relative” is used because we are measuring the difference in phase between two signals, not between one signal and an absolute 0° reference.) The Y-axis ranges a total of 360°, giving a straight-line view of the phase value on the circular phase cycle.
Visualize a racetrack. You can see where each car is on the circle, the difference being their relative phase. However, it can be a challenge to know whether they are on the same lap or not. So it is for these analyzers.

Figure 1a: Phase response (lower window) of a 1sm delay line
The screen shots shown in Fig. 1 introduce the relative phase over frequency graph. Figure 1a illustrates the response of a delay line with 1 ms of delay. The delay is the same at all frequencies, yet causes a different amount of phase shift at all frequencies. Why? Because 1 ms of delay causes a different percentage of change in the circular phase cycle. At 1 kHz, the 1ms delay is a full 360° cycle. Note that at 1 kHz, the phase response has returned to 0° after going down to -180°, up to +180° and back down. The sudden break in the response at 500 Hz is not a phase anomaly, but rather a visual representation of the circular nature of the phase response, where +180 and -180 are the same point on the circle. This is called “wrap-around” and denotes a full cycle of delay when it reaches back to 0°. Going back to the racetrack analogy, the measured response is a lap behind the original signal.
Figure 1b: Phase response of a typical uncorrected loudspeaker system
Now let’s look at other frequencies. At 500 Hz, the response shows 180° of phase shift, a half-cycle. Because the period (1/F) at 500 Hz = 2 ms, half a cycle is again 1 ms. At 250 Hz, we have 90° of shift, which is [one quarter] of a wavelength of the 4ms period. Same delay. Going upward, you can count two wrap-arounds at 2 kHz. This is 720° of phase shift, i.e., two cycles of a .5ms period. At 10 kHz, there are 10 wraps for a total of 3,600°, which is 10x the 0.1ms period, and once again we have 1 ms of delay. The phase delay formula can be applied at any frequency to the above trace, yielding the same result.
Now we move on to a conventional loudspeaker. Loudspeakers typically exhibit phase delay that changes with frequency due to physics issues beyond the scope of this article. The result is an increase in delay at lower frequencies, unless electronic phase correction circuits are employed to offset it. Figure 1b is typical of uncorrected speakers and shows an ever-increasing amount of delay below 4 kHz, as shown by the downward slope in the phase response. In the phase delay calculations of the delay line, the results were always the same: 1 ms. But here, each octave will give different results for the speaker, ranging from 0 ms at 8 kHz to 16 ms when it reaches 60 Hz. For the listener, this means that the sound it reproduces is smeared over time.
As an example, here is the phase delay calculation of the uncorrected speaker for the range from 4 kHz to 2 kHz:
Figure 1c: Phase response of a loudspeaker with electronic phase correction
A loudspeaker with electronic phase correction is shown in Fig. 1c. Note that the phase response remains flat until around 250 Hz, where delay finally begins to accumulate.
Figure 1d:
The chart (Fig. 1d) shows the relative delay over frequency for each of the three examples.
Now, let’s stop for a moment to consider the ramifications of this phase delay. Our industry is on a never-ending quest to make it more difficult for listeners to answer the question, “Is it live or is it Memorex?” Live sound direct from an instrument to our ears does not have delay that changes with frequency superimposed on its original response. It is an artifact of speaker physics. We would not tolerate such phase smear in our consoles or any other piece of gear. As speaker technology improves, the remaining clues that we are listening to speakers, such as distortion, horn signature and other artifacts, are reduced. Phase delay is a subtle but critical clue to our ears, and its reduction puts us closer to the real thing. All other things being equal, the speaker with the flattest phase response sounds the closest to being there live. Every time.
PHASE AND POLARITY
Before we move to the next section, time for a pop quiz. How many milliseconds of delay results from 180° of phase shift?
Is that your final answer?
The correct answer is, “That’s a trick question.” Why? Because a frequency must be specified. So how many milliseconds of delay are equivalent to 180° of phase shift at 250 Hz? The answer is 2 ms.
Now, how much time delay do we get when we put a phase reverser in-line? It reverses all frequencies by 180°, so it must delay each one by a slightly different amount. That is quite a fancy delay circuit there! And I thought it was just swapping two wires! In reality, there is no such thing as a “phase reverser.” It is a polarity reverser. Polarity reversers do not delay the signal. They invert the voltage or pressure component of the signal. While this does shift the phase, it does not change the phase delay time. That is not to say that a polarity reverse is unimportant. Anything that affects the phase will dramatically affect the way that different signals combine.
Figure 2
When two signals of the same frequency are combined, the summed response may be greater than or less than the original signals, depending on the phase. One plus one equals two, one or zero if summed at 0°, 90° and 180°, respectively. In a speaker array, the amount of addition will depend upon how close to 0° phase difference there is in arrival times. The tendency of speakers to add or subtract is shown in Fig. 2, which illustrates the hemispherical nature of combination. Signals that combine on the 90° to 0° to 270° hemisphere will achieve constructive addition. Signals on the 90° to 180° to 270° side will subtract. Constructive addition is easily done at low frequencies where it takes path length differences of several feet to move out the speaker of the addition zone. The highs, like football, are a game of inches.
Figure 3a: Coverage pattern of a single speaker
Figure 3b: Combined coverage pattern of two speakers, splayed at 60 degrees
The relationship between phase and polarity is illustrated in the series of simulations in Fig. 3. In this series, two speakers are splayed 60° apart, and the response is viewed at 250 Hz. In 3a, the response of a single unit is shown as a directional pattern reference. In 3b, both speakers are enabled, and the response shows a beam at the center of the array where the speakers combined at 0° relative phase, yielding 6 dB of addition over the response of a single unit at that location. The sides of the beam are formed in the area where the speakers are 90° of relative phase apart, creating minimal addition. The nulls are caused as we move into the cancellation hemisphere, with the deepest spot being 180°. Side lobes appear where the signal is a full cycle (360°) out of time, allowing addition to occur again. At different frequencies, the position of the nulls and side lobes will change. The time between the cabinets stays the same, but the change in frequency causes the relative phase to change.
Figure 3c: Two speakers (60-degree splay). One speaker has its polarity reversed.
In Fig. 3c, there has been a polarity reversal in one of the speakers. The amount of energy generated by the speakers is the same as before, yet where it goes has reversed completely. Now, the side areas contain the bulk of the energy, while the on-axis area is in a null.
Figure 3d: Two speakers (60-degree splay). One speaker has a 2ms delay.
Finally, in 3d, we have a delay of 2 ms on the lower speaker. This is half a wavelength at 250 Hz. The 2ms delay steers the sound downward toward the delayed speaker in the direction of where the 0° addition area is centered. (This technique can be used to optimize arrays, the subject of Part 2.) Compare this to the polarity reversal above where the signal is flipped 180° (half a wavelength), but the result is quite different.
CONCLUSION
We should now be comfortable with the concepts behind a phase response measurement and have a feel for how phase affects our speaker systems. While phase is hard to see, its effects are easy to hear, and with increased understanding of phase, we can begin to harness its power rather than react defensively to its unexpected effects. In Part 2, we will actively use the phase response in the optimization of crossovers, the alignment of arrays and the steering of subwoofers.
Bob McCarthy is a contributing editor to Mix.