Now in its second generation, TerraSonde’s Audio Toolbox Version 2 is a collection of DSP-based maintenance tools that any studio will find useful. The original Audio Toolbox Version 2 is compact and lightweight and covers a wide range of useful functions. Other versions include a rackmount model and a handheld “Plus” version.
The Toolbox performs so many functions that it would be difficult to detail them all, so I will describe the primary functions and discuss the unit’s overall performance. As acoustics is my specialty, I have concentrated on those functions.
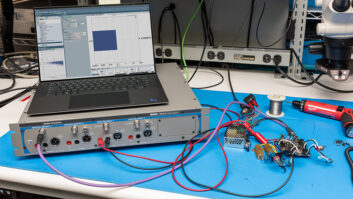
THE HARDWAREThe standard box measures 5.5×9.5×2.5 inches, weighs only 2 pounds and is made of molded plastic with a 2.4×1.75-inch backlit LCD screen. A single knob switches between programs and is used to make parameter adjustments and data entries. A calibrated microphone is built into the unit, but you can also connect any measurement mic. The box seems rugged, although I typically wrap the unit in bubble-wrap when shipping. It can be powered by a removable battery pack (six AAs) or a wall wart power supply.
Inputs and outputs are mounted on the sides of the box. Balanced XLR, 11/44-inch and RCA left and right inputs are available. There is one MIDI input and two MIDI outputs, along with a single headphone jack, a small built-in speaker and single RCA, 11/44-inch and XLR outputs.
THE SOFTWAREThe main menu offers four functions: Acoustic Analysis, Test Functions, Session Helpers and Utilities. Six submenus under the Acoustic Analysis menu include Sound Level Meter, Real-Time Analyzer, Energy Time Graph, Reverb Decay Time, Polarity Tester and Noise Criteria.
The Sound Level Meter function measures loudness in standard dB SPL units. It is a true RMS measurement, using ANSI Type 1 standard display time averages with A, B, C and flat weighting networks. Averaging modes include Slow, Fast, Impulse, Peak and LEQ. LEQ is used for computing equal-weighted SPL averages over a long period (for you OSHA types). The internal or external mic can be selected, with two sensitivity ranges available. Measurement data is presented as both a numeric readout and a bar graph. Full control of the signal generator is available directly from the Sound Level Meter screen. Selectable waveform types include sine and square (frequencies are adjustable) and white or pink noise.
The Real-Time Analyzer looks at the sound spectrum in 1-, 11/43-, 11/46- and 11/412-octave bands, with good resolution although the screen is tiny. Data can be viewed in a full-bandwidth window of 20 to 20k Hz as well as a low-frequency 10-to-332Hz window, a useful view that covers the area of most critical analysis. A variety of averaging times is provided for exponential or equal-weighted time averaging. The display is adjustable in 5dB increments with a 35dB window range from top to bottom, offering a wide picture of spectral activity. The low end of the scale is 25 dB with the maximum being 170 dB. One cool “extra” field gives a variety of useful additional information, such as the band that has the highest momentary level (Hz max), the full-band SPL level (dB SPL), the A-weighted SPL (dBA SPL), or the C-weighted SPL (dBC SPL). To assist in setting surround 5.1 monitoring systems, two more fields measure dBL SPL and dBm SPL. dBL shows the average SPL level of the subwoofer bands (as defined by Dolby Labs), 25 to 125 Hz, while dBm SPL shows the average SPL of the nonsubwoofer bands. I tend to rely more on the spectrum display for subwoofer calibration, but this feature offers a handy correlation. Forty nonvolatile memory locations for storage can be recalled in the Toolbox or transmitted to a PC or Mac for printing. Data parameters for the recalled memories can be adjusted for critical analysis.
The Energy Time graph displays the initial delay time from the sound source and the subsequent decay pattern in the room. This is useful for finding room reflections, identifying resonances and aligning delay systems. The data can be viewed as time or distance, with the measurement units displayed in milliseconds, feet, inches, meters or centimeters. (I did not find a frequency display effective.) The capture window is adjustable for the measurement units. For example, in milliseconds, the window ranges from 15 to 960. This is handy for controlling the amount of detail you need. Moving the cursor across the screen displays the time (or distance) for that point numerically, along with the dB level relative to the maximum value received. This lets you find room reflections in units of distance. While the program is running, you can zoom in on areas of the chart for more detailed analysis (15ms window). You can store 40 graphs in nonvolatile memory with the same functionality as the RTA.
The Reverb Decay Time function computes the reverb decay time for a room, referenced to RT60. The full-band (20 to 20k Hz) flat measurement is actually extrapolated to find the RT60 value, since a full 60 dB of S/N ratio is often not available (a minimum of 30dB S/N is recommended). The Decay Time field displays the actual time (in milliseconds) for the sound field to decay by the displayed Decay Range amount.
The Polarity Tester function is worth its weight in gold-a decent tester costs $250 to $300 alone-and I can’t tell you how many times I’ve found studio speaker components out of phase! Toolbox lets you test mics, patchbays and anything else in the studio with an innie and outie. Since it’s tethered to a cable, the one-piece unit can be a bit restrictive when “popping” speakers, but this is a minor inconvenience. If you have older gear, remember that Toolbox is a pin-2 positive unit. Three separate setups are programmed into the polarity tester for testing speakers, microphones and line-level equipment. A signal strength meter lets you adjust volume levels to get a good reading (most other testers can give false readings at improper levels).
The Noise Criteria function is used to determine the background noise level in a room, according to ANSI specification S12.2-1995. In operation, the room noise is divided into octave-band divisions, and the acoustic level of each band is computed in dB SPL. Then, the results are compared to standard noise criteria curves and a single value is determined from the highest curve number that any octave band exceeds. Also, the Speech Interference Level (SIL) can be computed. This value is the average dB SPL level of four octave bands centered on 500 Hz, 1 kHz, 2 kHz and 4 kHz. SIL is also defined in the ANSI standard that specifies Noise Criteria. These functions don’t mean much to the average studio owner but are necessary for comprehensive field measurements.
TEST FUNCTIONSThe Test Functions submenu offers Signal Generator, Level Meter/Frequency Counter, Signal-to-Noise Ratio, Sweeps, Sample Scope and a Distortion Meter.
The Signal Generator offers a control surface for acoustic measurement programs and creates waveforms used in testing, audio analysis or recording. Output levels for sine and square waves, white noise and pink noise can be adjusted in fine and coarse modes, while the unit displays the actual output level present, including loading from the device connected to the outputs. A Polarity Waveform feature lets users test polarity within a circuit; an Impedance Meter function is also provided.
The auto-ranging Level Meter accurately measures the level for both inputs simultaneously. Four submenus are available: a stereo audio level meter, a stereo frequency counter, a stereo dB meter and a stereo VU meter. The signal level units may be selected from among dBu, dBV, Vave, Vrms, and Vp-p and are displayed numerically. Readouts are displayed numerically, as well as with bar graphs for the VU and dB meters, and include peak indicators. In the Frequency Counter, both inputs are read and displayed independently. The frequency counter requires a fairly clean repeated waveform (such as a sine wave), and if the frequency cannot be determined, the figure “-” is shown. The range is 16 to 50k Hz; +4dBu and -10dB modes are available. The meters have very good resolution for fine adjustments.
The Signal-to-Noise function allows you to test the S/N ratio for any line-level device. This is a simple subtractive measurement and operates at +4 dBu or -10 dBV.
There are three Sweep functions: Frequency Response (amplitude) sweep, Impedance sweep (impedance of a load vs. frequency) and a programmable sine wave sweep. The Frequency Response function computes the gain of a device as a function of frequency. The Impedance sweep computes the impedance of a load as the signal generator is swept continuously from 20 to 20k Hz. The x-axis scale is variable from 20 to 20k ohms. Both the Frequency Response and Impedance sweep functions can operate in 11/43- or 11/412-octave mode, and the function averages the results over the selected 11/43- or 11/412-octave band. Results are displayed graphically on the LCD. Start and end frequency points (11/43-octave), as well as duration, may be set for the programmable sweep. There are 40 nonvolatile memories available in this mode.
The Sample Scope is essentially an audio bandwidth digital oscilloscope. While a typical digital oscilloscope has a bandwidth of several megahertz, the Sample Scope only has a 48kHz bandwidth, so this is a very low-resolution display in comparison. Also, DC is blocked, so only the AC component of a waveform is viewable. High-frequency waveforms (above 10 kHz) may not be represented properly. The scope was just barely useful for setting azimuth on a tape machine. The scope can also be used for identifying repetitive waveforms and obvious clipping, distortion and over-ranges, or a graphical phase meter when used in X-Y mode. It is slow, so while it does tell you what is going on, I would much rather use a dedicated scope. You can vary the screen-time width from 2 to 80 ms, and you can turn on the 30dB input pad or 40dB input gain amplifier. The vertical scale can be adjusted from 1 to 64 times. The Sample Scope auto-triggers, so repeated waveforms may be seen. The maximum on the vertical scale is 0 dBfs (full-scale digital), so you can see if an input signal is clipping the digital input.
The Distortion Meter uses FFT analysis to compare the level of the fundamental frequency with its harmonics. This function generates a sine wave at either 63, 125, 250, 500, 1,000 or 2,000 Hz, and sums the energy in the upper harmonics (and residual noise) to compute the THD+N. The range is 0.2 to 50%. The optimum frequency for lowest residual distortion is 125 Hz. At this frequency, you can read down to nearly 0.15%. The input signal level (line or mic level, selectable) must be constrained within a window, so a small bar-graph level meter is provided. The display shows the value numerically, and also has a bar graph using a log-scale from 20 to 0.1% THD. I primarily use this function for testing speaker distortion so that I can catch failure before it occurs-many speakers exhibit increasing amounts of THD as they age.
GETTING AROUNDMenus, programs and parameters are selected using a single “encoder” knob: Turn the knob to select a file and push it to select the item (if it is a menu choice) or change the value of the field. Some fields are changed by clicking the knob and some by clicking and spinning the knob (the difference is indicated on the highlight line under the selected parameter).
Some screens have shortcut fields for jumping directly from your current function into another, performing the task, and jumping back into the first function without using the menus. Currently, there are two fields that work this way: the Gen field and the Mem field. On functions that display the Gen field, when you click, you will jump directly to the Signal Generator screen. From there, you can adjust the settings of the internal signal generator, such as the frequency, level or type of signal, and then jump directly back to the previous function.
As stated earlier, the screen is quite small, so you sometimes have to pay very close attention. Numeric readouts and bar graphs are just fine, but some of the high-resolution charts require close scrutiny. The “Plus” version has a larger screen.
A QUESTION OF ACCURACYThe real value of test equipment is not how many functions it performs but whether it performs those functions easily and accurately. I tested the internal mic calibration with a B&K 4231-it was spot on. I then put the Toolbox next to a B&K 2260 Investigator and a Meyer SIM System II. While the majority of readings looked pretty good, I did find a couple of discrepancies with readings between the Toolbox and both the B&K and SIM. I talked to TerraSonde about this, and they said these issues had been addressed in the upcoming software version-these guys are dedicated to the box and respond well to feedback from the more than 1,000 Toolbox users in the field. However, one problem not yet addressed involves using the RTA with the internal mic. I saw a bump at 13 kHz that I attribute to the mic proximity to the body of the Toolbox (the bump did not show up when an external mic was used). I recommend using a good measurement mic for critical HF evaluations.
The only thing that I found annoying about the TerraSonde’s operation was a speaker pop when turning the noise signal on and off. TerraSonde says it will address this.
Otherwise, the Toolbox worked well. Stored program defaults make the Toolbox power on to a specific set of parameters I always use when performing certain measurements. Although the box comes factory-calibrated, the Setup and Calibration modes allow you manipulate a vast number of system features. Beware: Unless you’re a pro with great equipment, you don’t want to mess around with this, but it’s useful for calibrating external microphones.
There is not space here to describe all of the Toolbox functions, such as Session Helpers (Instrument Tuner/Tempo Computer/MIDI Helper/MIDI Transmitter/Time Code Tools/Hum Cancellation) and Utility Functions (Monitor Amp/Cable Tester/Phantom & Battery Power Tester). A detailed description of these can be found at www.terrasonde.com.
At $999, the Audio Toolbox is a very good buy. It performs many functions well, and I would encourage all of my clients to have one on hand for those cases when I can’t be there in a timely fashion. For small-studio owners who are mostly do-it-yourselfers, it is a good investment that will improve the quality of their studios and help with maintenance. TerraSonde maintains an excellent Web site where you can also download the latest version of the manual and check out the latest hardware availability. The fact that TerraSonde supports both Mac and PC platforms is admirable.
TerraSonde, 1751 Redwood Ave., Boulder, CO 80304; 303/545-5848; fax 303/545-6066; www.terrasonde.com.