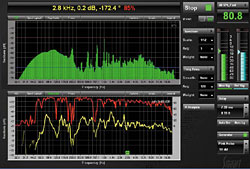
SmaartLive’s two-up screen allows of any combination of RTA, Spectrograph, Magnitude or Phase displays. RTA (top) and Magnitude are shown here.
Over the years, SIA Smaart has revolutionized the pro audio industry, offering dual-channel FFT analysis at an affordable price. Now in Version 6, EAW Smaart offers a streamlined interface that’s easier to navigate and faster than previous versions because it’s been rebuilt from the ground up. Smaart 6 is available for Windows 2000/XP/Vista and Mac OS 10.4. I’ll focus on the Windows version, which is what I use, but many of these techniques also apply to the Mac platform.
SEE WHAT YOU HEAR
Smaart 6 allows a two-up display of any combination of RTA, spectrograph, magnitude or phase readings. Connect your cue bus to Smaart in Spectrum view to display whatever you cue up. The RTA is in real time, while the Spectrograph shows frequency and amplitude over time, which is especially useful for finding drum resonances, problem frequencies onstage or when EQ’ing lavalier and podium groups.
You can find room resonances by using terminated pink noise while viewing the Spectrograph. Place your measurement mic in the room, and with the Spectrograph display active, play pink noise into the room and set your levels. Mute the pink noise and note which frequencies continue to ring.
CHECK YOUR MICS’ RESPONSES
From the Magnitude display, connect your measurement mic as the reference channel and your favorite mic as the measurement channel. Place the capsules on-axis and close together about 10 feet in front of a speaker. Use Auto-Small to set delay, and you’ll see your mic’s frequency response. Without moving the reference mic, change the angle of the testing mic to show the response at various angles. This is useful for showing frequencies that are likely to feed back and finding the best off-axis angles for placing wedges or loud instruments.
MAKE YOUR OWN POLAR PLOTS
Place your measurement mic about 10 feet from your speaker. Play pink noise through the speaker. Start the Spectrograph. Press Stop when you reach one division on the graph. Turn the speaker 5 degrees and repeat the previous step. Continue through 360 degrees of rotation, and you’ll have a decent 2-D polar plot on the screen.
QUICK TRACE CAPTURING
To capture a trace, press the space bar. A Capture dialog box pops up, where you can name the file or press Enter to save the captured trace. To view the Trace Legend, use Alt + L. Once the Legend is open, you can select a trace, choose to show/hide it using the buttons in the legend, delete it using the Del key or move the front trace up/down using Ctrl + the up or down arrows.
Pressing Ctrl and then clicking on the screen at the desired location will lock the cursor position. With the cursor locked, press H for that frequency’s harmonic view. Successive H key-presses will toggle between even/odd/all/off. Pressing Ctrl + X removes the cursor lock.
SCREEN SUNGLASSES
Bright sunlight can be a problem when using a laptop outdoors. Select High Contrast View from the Options menu, which turns the text black and the background colors white. You can also make the plot lines thicker from the Options window on the Freq Resp tab. Under Graph Parameters, select the Line Thickness drop-down and choose “2.”
When in Freq Resp view, the trace will not settle on some newer computers, even with a lot of averaging in some cases because the software calculations are so fast. As all measurements run at all times, a workaround is to increase the FFT size of the Spectrum measurement. This increases CPU overhead, thus slowing down and settling the jittery trace. Click on Options -> Spectrum, go to FFT Parameters and use the FFT Size menu.
THE PHASE TRACE
The Phase Trace is useful for fine-tuning your crossover alignment, delay rings and seams between subsystems. The horizontal, flat part of the phase trace shows where the reference and measurement channel are arriving in time. The left side of the horizontal flat spot (usually a left-to-right downward slope) is where the measurement channel lags behind the reference. The right side of the horizontal flat spot is where the measurement channel leads in time (usually a left-to-right upward slope). One complete wrap equals 360 degrees.
SUB-TO-MAIN ALIGNMENT
Use 32 or more averages. Place the measurement mic close to the floor, about three-quarters into the room. Un-mute the lows on one side. Use Auto Lg (press L, then Enter) to set Smaart’s internal delay. Go to Freq Resp and capture a trace (press Space, then Enter). Mute the LF drivers and turn on the subs. Adjust the sub drive so that the levels match to the low trace at the crossover frequency. Do not adjust the delay within Smaart, but rather on the sub output of your system controller until the phase response of the subs is parallel with the lows through the crossover frequency.
If the phase overlaps, you’re done. If the phase trace is parallel through the crossover region but not overlapped, this usually indicates that the sub polarity needs to be inverted. Invert the polarity of the sub drive and verify that the traces overlap through the crossover. These examples assume your subs are closer than your mains. You may need to reverse the order (delay the mains) if you’re using horn-loaded subs with a stacked P.A. system.
Harry Brill Jr. is a freelance front-of-house engineer, A1 and system tech based in the Orlando, Fla., area.