| MIX VERDICT: Sonible Metering Bundle |
| THE TAKEAWAY: “True:Balance and True:Level have quickly become end-of-the-master-bus staples for me, both for mixing and mastering.” |
| COMPANY: Sonible • www.Sonible.com PRICE: $69 PROS: • Easy-to-read graphical and numerical displays. • Easy to compare your music to common reference levels, standard targets, or uploaded reference tracks. • Balance Check, Mono Check (True:Balance) and Level Check (True:Level) features offer helpful, text-based guidance. • Informative tool tips and thorough manuals. • Excellent value. CONS: • (True:Balance): Mono Check doesn’t sum audio. |
Over the past couple of years, Austria-based software developer Sonible has built an impressive portfolio of plug-ins, including Smart:Comp, Smart:Limit, Smart:Reverb and Smart:EQ. Those processors analyze your music, and with the help of AI, create intelligent starting-point settings.
The two plug-ins in the new Metering Bundle, True:Level and True:Balance, have a different modus operandi. They provide you with precise measurements of spectral balance and loudness, respectively, and compare those with reference levels for different genres or with uploaded reference tracks of your choosing.
Both plug-ins feature helpful tool tips and thorough manuals to help you learn their features quickly.
True:Balance and True:Level require Windows 10+ or Mac OS 10.12 and will run natively on either Intel Core i5 or Apple M1 processors.
TRUE:BALANCE
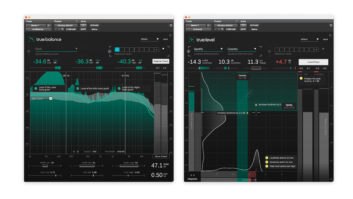
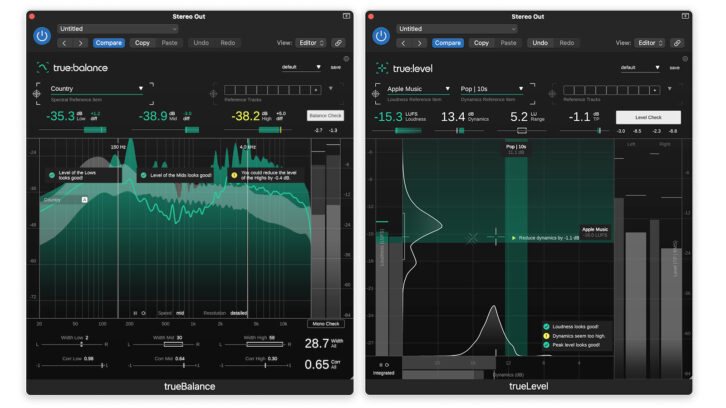
True:Balance is a real-time spectrum analyzer that allows you to compare the frequency balance of your mix against the average for various music genres or user-uploaded reference tracks. In addition, it provides stereo width and correlation indicators for checking mono compatibility. You’ll notice some similarities if you’ve ever used iZotope’s Tonal Balance Control 2.
After inserting True:Balance on your master bus and opening it, you’ll see that the central part of the GUI is broken into thirds, for Low, Mid and High-frequency ranges. Most of the space is taken up by the large Spectrum Display, which shows level on the y-axis and frequency on the x-axis.
With the Common References dropdown from the Reference Selector on the upper left, you get a choice of 12 music genres, a Universal reference, and two for speech and one for podcasts. The Low, Mid and High-frequency ranges of the reference get displayed in a gray area called the Reference Zone. The idea is to get your mix’s frequencies to fit inside of it.
When you hit play in your DAW, True:Balance shows a real-time display of the energy in each zone. A green line across the display represents the average levels of the lows, mids and highs in your audio. You can instantly see where it conforms or doesn’t.
What’s more, True:Balance provides a real-time numeric readout for each frequency zone, which indicates its level in dB and also shows how much it varies from the chosen reference. The numeric displays are also color-coded. For each zone, if your audio is within the reference range, the numbers stay green. If not, they turn yellow.
Clicking on the Balance Check button provides text-based guidance. For example, if the average level of the lows in your mix is within the reference area, it will say, “Level of the lows looks good.”
iZotope RX 10 Advanced – A Real-World Review
Or if the midrange is 2 dB too high, the text would say, “You could reduce the level of the mids by 2 dB.” If you want to change the crossover points, you can drag the lines separating the zones (I never found a reason to do this, but I’m sure others will).
You can also adjust the speed and resolution of the Spectrum Display by choosing between Slow, Mid and Fast response for the former and Smooth, Medium and Detailed for the latter.
Stereo width and correlation data, organized by the three frequency zones, are presented with horizontally oriented indicators at the bottom of the GUI.
The former shows your audio’s width in the three frequency zones. One of the essential uses for this data is knowing when the bass energy is too wide. Because our ears don’t perceive stereo as much in bass frequencies, there’s no reason for the bottom end of the mix to be wide, and it can cause phase issues if it is. In a couple of the mixes I did while testing True:Balance, it indicated that the bass frequencies were too broad and needed to be reduced.
Pressing the Mono Check button gives you text-based advice about the Correlation and Width values. You’ll also see a squiggly yellow line at the top of the Interface. According to Sonible, if that line stays static, it indicates that you may have comb filtering when your mix is summed to mono.
One aspect of Mono Check that threw me was that when I turned it on, the audio stayed in stereo. Although the visual features of Mono Check show you the info you need to know, it’s disconcerting to press a mono button and still hear stereo. It would be helpful—and less disconcerting—if you could hear the effect of the summing as well.
TRUE:LEVEL
Now that so much music gets mastered for streaming services, a loudness meter has become an essential tool. To that end, the True:Level plug-in gives you an easy way to check LUFS, True Peak and the Dynamics of your music.
More than just a meter, it lets you compare your audio’s loudness to reference targets for various streaming services, broadcast standards and more, and it lets you know when your levels comply.
The first thing you do once you open the plug-in on your mix bus or master track is to choose a reference from the Reference Dropdown. In the case of True:Level, you pick two, a Loudness Reference and a Dynamics Reference.
For loudness, the dropdown menu offers more than 20 choices, including targets in LUFS for all the primary streaming services for music, podcasts and video. You can also choose from loudness standards such as EBU R128 (from the European Broadcasting Union), ATSC A/85 (for digital TV) and others.
For the Dynamics dropdown, you get a choice of 26 references, including five subgenres of electronic music, three variations of hip-hop, three rock varieties, jazz, country, Latin, metal, speech and more. You can use the Universal setting if your music genre isn’t on the list. Alternatively, you can upload up to eight different reference tracks for comparison and switch between them.
Reference Tracks are activated by clicking on them. True:Level will include all active ones when computing its level targets.
For measuring dynamics, True:Level offers two measurements: Loudness Range (LRA), reported in Loudness Units, is the difference between the loudest and quietest sections (not including silence); the Dynamics readout in dB is described by Sonible as “the median of all measured PSR (peak to short-term loudness ratio) values.”
True:Level’s graphic display includes a vertically oriented, combined Short-Term and Momentary LUFS bar-graph meter, in which the Momentary readout is less opaque than the Short-Term. Once you understand how it works, it’s pretty easy to read. Next to it is a bar graph showing Integrated LUFS.
Below is a horizontally oriented Dynamics meter showing Short-Term, Momentary and Integrated Dynamics. To the left side of the main display, you’ll find a histogram display of Short Term loudness during the measuring period, allowing you to see the peaks over time. On the horizontal axis is a histogram of short-term dynamics values. If you press the Reset button, it will restart both histograms.
The primary graphic display is called the Loudness and Dynamics Grid and features a graph that shows loudness on the vertical axis and dynamics on the horizontal. A shaded green zone indicates the loudness reference level, and a lighter green one displays the dynamics reference level.
The Loudness and Dynamics Crosshairs proved a useful feature. When both the loudness and the dynamics of the audio are within the reference zone, you’ll see the crosshairs turn from white to green.
You’ll also see smaller crosshairs moving in the grid representing the Short-Term and Momentary Loudness and Dynamics readings. The Loudness and Dynamics Grid defaults to a timebase of Integrated values, but you can change that to Short-Term or Momentary if you want.
Above the graphic display are numeric readouts for LUFS, Dynamics, LRA and True Peak in decibels (dBTP). Finally, on the right is an output meter in a bar-graph format that reads both in dBTP and RMS.
Pressing Level Check is similar to the Balance Check button in True:Balance, except that it gives you text-based advice on whether your LUFS, Dynamics and TruePeak levels need to be cut or boosted to comply with the reference targets.
Using a limiter for adjustments and True:Level to display the changing levels, I was able to get my audio into compliance with my chosen targets quickly.
TELL THE TRUTH
True:Balance and True:Level have quickly become end-of-the-master-bus staples for me, both for mixing and mastering. Whether I used True:Balance to check spectral balance or True:Level for Loudness, True Peak and Dynamics, I quickly got the data I needed. I highly recommend them both.