Even with the best monitors, achieving an ideal mix is a challenge. Assuming that your hearing is decent and you have well-recorded tracks to work with, your mixes can suffer because of effects from the Equal Loudness Curve. This details the ear’s spectral sensitivity, a phenomenon that’s uneven at all sound pressure levels (SPLs) from the Threshold of Pain down to the Threshold of Hearing. To make matters worse, many of us work in acoustically imperfect rooms. We can’t change the forces of nature or transform everyone into a world-class mix engineer, but by examining a few basic issues of control room acoustics, we can improve the performance of less-than-optimal spaces.
Here’s a list of tools (some of which you may already have) for basic acoustical troubleshooting: a sweep oscillator, an omnidirectional microphone, any device with a high-resolution meter and digital converters. Some less-obvious (but easily acquired) tools include balloons and a rubber mallet. In addition, software for this month’s sonic shakedown include WaveLab (www.steinberg.net), Smaart (www.siasoft.com) and Cool Edit Pro (www.syntrillium.com).
BOUNCING OFF THE WALLS
Often, when acousticians look at a room, the audio spectrum is divided into five critical bands (125/250/1k/2k/4k Hz), with the goal of making the decay time consistent across this spectrum. Treatment for each frequency band is not the same, because bass behaves much differently from treble. One of the most basic tests is to listen in mono for the phantom center and then switch back to stereo. Is the image stable? Can you “touch” it? Is it full-bodied or scattered? Optimized rooms focus more sound directly at the listener. What can degrade the image? Let’s start with clutter.
To start, tidy up the crib. Remove all gear that may be obstructing or reflecting the primary path between the monitors and the listener. If stereo imaging tends to slide around, then redefine the room’s center, get out the tape measure and symmetrically align the work area: the monitors, console and equipment racks. Detail the room’s particulars using familiar artistic tools (paper or virtual), making sure to measure accurately.
From an acoustics-measurement perspective, the three essential tests are spectrum analysis, decay time and impulse response. Spectrum analysis displays amplitude vs. frequency, but doesn’t provide any insight into why the response is so lumpy. Adding the dimension of decay time reveals the presence of reflections, while impulse response can reveal specific reflections all the way down to the timing between woofer and tweeter.
That fact that each band should have a similar decay time cannot be overemphasized. It’s pretty obvious that high frequencies — responsible for positional (localization) cues — are easily reflected by hard, smooth surfaces. To get the best “cues,” you want only direct sound from the monitors. High-frequency reflections can be tamed three ways: by repositioning equipment; by applying porous, absorptive material in the immediate sound field; and by using diffusion (uneven surfaces) in areas that will not distract the listener or corrupt the stereo image. Too much absorption will exaggerate the problems in other frequency bands.
In order for bass to bounce off of a wall in a similar fashion to treble, that structure would have to be infinitely more rigid and dense, like a sand-filled concrete block or poured concrete. Sheetrock™ walls can absorb, reflect or resonate when stimulated by bass and midrange. Whether by accident or on purpose, this example shows how wall construction and problem-specific traps can be built to physically tune the room like an equalizer, including “Q” (bandwidth). This can be good, bad or ugly, depending on the location in the room where this happens, room size, shape, and the room’s length/width/height ratio. Get out your fist or rubber mallet and pound the walls while listening for resonance — it will be all over the map.
What other accidental contributors might there be? Windows (the glass kind; not the OS) and the ductwork inside the walls can be problematic or nightmarish, especially when you are using a generic room for sonic purposes. If you’re at the planning stage, then evaluate the room before putting all the gear in. Ripping out Sheetrock is a messy business.
DIMENSIONS
The relationship of height (H), length (L) and width (W) can be magical or disastrous; a cube-shaped room is least desirable. The ratio of these dimensions will play a large part in determining the “modes”: places where buildups occur. Two examples of preferred ratios are 1:1.14:1.39 (a small room that’s 10×13.9×11.4 [H×L×W] feet) and 1:1.6:2.33 (a larger room of 10×23×16 feet).
Reflections refer to three modes that detail the number of surfaces sound will hit — and bounce from — in an untreated room: axial (two surfaces), tangential (four surfaces) and oblique (six surfaces). The dimensions and the number of reflections create sonic bumps and dips across the frequency spectrum. Larger rooms have less-destructive modes and support lower frequencies.
SHAKE-DOWN
A sweep oscillator is all that’s needed for the first test; it’s not for absolute measurement purposes, but feel free to put up an omnidirectional mic at the sweet spot and document the proceedings. Start at 1 kHz and slowly sweep down into the bass region while listening for (and fixing) rattles. This might keep you busy for a while. If you are taking notes, then perform separate tests for left/right/both monitors. You’ll be amazed at how different the response for each will be.
While an oscillator is not the right tool for the job, it does provide some insight. The room should be perfectly flat, but I’ll bet you noticed lots of peaks and dips during “the sweeps.” A well-played and dynamically processed bass part can be similarly flat, although a funky room can make it seem inconsistent. Knowledge of music and of the notes that seem boomy or lost can be integrated into the interrogation process.
A standard electric bass guitar covers over three octaves. Here are some bass notes translated into audio frequencies and MIDI notes:
E Open (E1): 41.2 Hz, MIDI #28
A Open (A1): 55 Hz, MIDI #33
A Fret 2 (B1): 61.74 Hz, MIDI #35
D Open (D2): 73.42 Hz, MIDI #38
E Fret 12 (E2): 82.4 Hz, MIDI #40
G Open (G2): 98 Hz, MIDI #43
A Fret 12 (A2): 110 Hz, MIDI #45
G Fret 4 (B2): 123.47 Hz, MIDI #47
G Fret 7 (D3): 146.83 Hz, MIDI #50
G Fret 9 (E3): 164.81 Hz, MIDI #52
G Fret 12 (G3): 196 Hz, MIDI #55
Once the problematic frequencies are known, you can calculate the offending distances using the formula: Wavelength = 1,126.8/frequency.
The “constant” is the speed of sound at room temperature: 1,126.8 feet/second. Having documented all of the bumps and dips, plug a few of those frequencies into the formula to see if any wavelengths correspond to the room’s obvious dimensions. My room, depicted in Fig. 1, had a bump at 160 Hz, just a bit shy of E3; its 7-foot wavelength corresponded to the ceiling height. An online wavelength calculator can be found atwww.eatel.net/~amptech/elecdisc/frequncy.htm. Just plug in the numbers and play.
HEAVY ARTILLERY
After the basics were out of the way, I consulted with Dave Meyers at Overkill Audio. He brought over balloons, and we popped quite a few in several places: in front of the monitors and in each cavity (entrance and storage). Even before analyzing the recording, this test helped us find several sympathetic resonators, like the window behind the left speaker and ductwork along the right speaker wall. These remarkably obvious problems were otherwise hidden when we were listening to music.
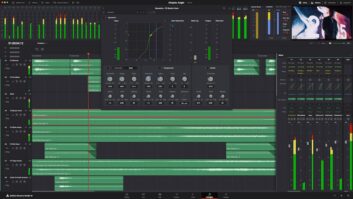
Dave suggested Smaart Live ($695 list), a powerful and affordable analysis tool that runs on a PC. A 30-day demo version is available from www.siasoft.com. The resolution of Smaart’s spectrum analyzer goes up to 1/24 octave; we used 1/12 octave. Pink noise was pumped into this average (undersize and under-treated) control room (mine), and considering the sine sweep, it wasn’t too frightening. The “before” image was saved and combined with the “after,” as shown in Fig. 2.
IMPULSIVE
In a large space, like a studio or concert hall, reverberation time is stated as RT-60 (the time required for the signal to be attenuated by 60 dB). It’s a little different in a control room where the “R” is more like “resonance and reflection” than reverberation.
Steinberg’s WaveLab ($599 retail) has great time-domain capabilities. Using its signal generator to create an impulse, its time-domain tool helped determine LF/MF resonances and MF/HF reflections. You can do a similar test on any editor (such as Cool Edit Pro: $249 online) by recording a balloon “pop” and then measuring the reflection in the waveform. Figure 3 shows the waveform as an insert (top right) along with the full-color analysis below. In this instance, time is from rear to front with the audio spectrum from left to right. This relationship can be reoriented to your preference.
As we learned via the balloon tests, the window contributed several very-low-frequency aberrations (plus rattling springs), while the ductwork quacked in the midband around 300 Hz. Above 160 Hz, the decay is obvious, but below that frequency, there is almost no decay within the half-second range of capture. In the insert, time moves from left to right: The large double arrow is the distance between the impulse and its first reflection. When the area is highlighted in WaveLab’s Waveform window, the time in milliseconds is displayed. From there, it was easy to calculate the actual distance of the reflection using a ratio, again based on the speed of sound: 1,126.8 feet/1 second = x/0.01 second (10 mS) = 0.01 × 1,126.8 = 11.268 feet (aka, room width).
“X” is the distance we’re looking for. Just cross-multiply. Because both denominators are in seconds and the left denominator is “1,” there’s no need to divide.
FIXES AND SUCCESS
I spent the next day applying damping materials to the windows, window springs and ductwork, none of which was considered the final treatment, but just to see if anything measurable would happen. It did! I also reoriented an absorber panel, opposite the left monitor, by 90°. The results are displayed in Fig. 2, where green represents the curve after tweaks. Any “gains” are shown in red, while the blue spikes represent resonance reduction (attenuation). The gains at the far right may have been microphone orientation. The losses at left were most likely the result of window dampening. In between, many of the losses were in the 3dB to 4dB range, while 1dB to 3dB gains were realized.
For each attempt at tweaking control room acoustics, I have been rewarded. These have all been little gains, and while this project’s goal was to improve the LF response, the sonic upgrade was full-spectrum. Most interesting was that the midrange listenability improved to the point where I wanted to pump up the volume. The phantom center became more like a sonic hologram; the improved stereo image revealed that the D/A outputs required L/R calibration. Previous tweaks — an overhead absorber — improved the localization range between 5 kHz and 7 kHz. Further tweaks extended this into the mid-band. Now, the sound space has more depth, more impact and more intimacy.
I did not go into detail about the materials used — mostly panels of Owens Corning Type 703 Fiberglas — because the experiment is ongoing. (OC’s 700 Series of glass fiber is a popular choice of acousticians because of its effectiveness, density and fire rating.) On my yet-to-do list, the room’s two windows will be replaced and the Sheetrock covering the two lengths of ductwork should be removed for full damping. There are still some peaks to tame, materials to try (3M Thinsulate, it’s not just for gloves and coats) and traps to build: The makings of a future article, for sure.
Ultimately, a control room should minimize the guesswork. Of course, you could hire a professional and I highly recommend that you find one who is compatible with your needs. But as always, I also recommend the DIY approach for the learning experience: In the worst case, you’ll know what questions to ask.
For more information, install a copy of How to Build a Small Budget Recording Studio From Scratch, recently updated by Mike Shea (TAB Electronics), into your porcelain office of choice.
Eddie would like to thank Dave Meyers (www.overkillaudioinc.com), Terry Hazelrig (www.diyacoustics.com) and Wes LaChot (www.overdublane.com) for sharing their expertise. Visitwww.tangible-technology.comfor tips on tapping maple trees and processing raw sap.