Las Vegas, NV (April 26, 2022)—At NAB, Nugen Audio unveiled its new Halo Vision plug-in, a customizable, real-time visual analysis suite operating in up to 7.1.2 channels for the AAX, VST3 and AU formats. Set to be released in late May, Halo Vision features a variety of modules designed for 3D, surround and immersive audio workflows, intended to provide users with a clearer understanding of their sound.
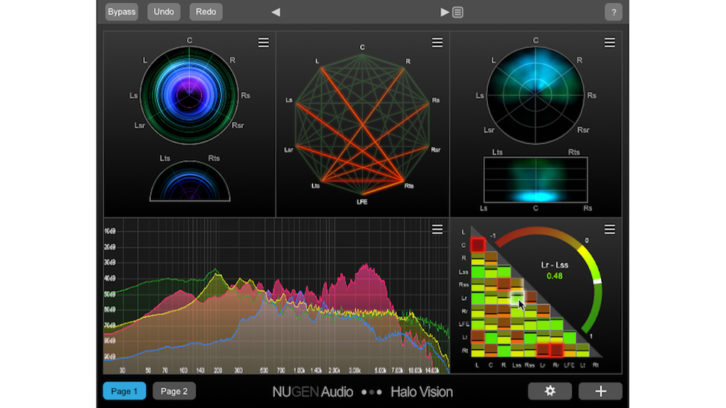
Among the available tools are a Correlation Matrix, Correlation Web and Spectrum, as well as expanded versions of Nugen’s Frequency Haze and Location Haze functions, and a True Peak meter for each channel. These modules are intended to help mix engineers pinpoint problem areas that might be missed using ears alone.
NUGEN Audio Paragon ST – A Real-World Review
Designed to display color-coded phase relationships between every channel, the Correlation Matrix also features a larger arched meter for more detailed analysis and anti-correlation alerts at a user-defined threshold. Additionally, the Correlation Web module shows a network of channels with an interconnecting line between each pair, which light up when the phase relationship between the two channels becomes anti-correlated.
With low frequencies at the center and high frequencies on the outer edge, the circular Frequency Haze displays frequency content across the surround field, with channel labels in typical speaker positions. Furthermore, the Location Haze tool provides a visualization of the perceived location of the audio, showing energy distribution across the surround field, with brighter sections indicating increases in the strength.
When set to ‘combined’ mode, the Spectrum view displays a level-against-frequency graph for all channels in one spectrum, while the ‘groups’ mode groups channels into separate overlayed spectrums. Finally, the incorporated True Peak Meter provides a dBTP level meter for each channel.